Initiating coverage | Textile
April 8, 2011
Siyaram Silk Mills
ACCUMULATE
CMP
`360
A growth yarn...
Target Price
`414
Siyaram Silk Mills (SSM) is one of the leading textile manufacturers in India. The
Investment Period
12 Months
company enjoys a strong brand presence across the country, with brands such as
Stock Info
Siyaram, Mistair, J Hamstead and Oxemberg in its kitty.
Sector
Textiles
Strong brand presence: SSM has built a strong brand presence in the country
Market Cap (` cr)
337
through continuous advertisement and brand-building efforts over the past 30
Beta
0.7
years. The company has created a niche for itself in a highly competitive industry.
52 Week High / Low
450/150
SSM enjoys a dominant position for its fabric segment under the Siyaram brand,
Avg. Daily Volume
21,685
which constitutes nearly 83% of its revenue.
Face Value (`)
10
Wide distribution network across India: SSM has one the largest distribution
BSE Sensex
19,451
networks in Tier-II&III cities across the country. The company has a strong network
Nifty
5,842
of over 1,500 dealers and 500 agents supplying to more than 40,000 outlets
Reuters Code
SIYR.BO
across India. This enables the company to easily launch new products with a high
Bloomberg Code
SIYA@IN
success ratio and low marketing cost, giving it an edge over competitors.
Higher utilisation and capacity expansion to drive growth: SSM’s yarn segment is
expected to achieve 60% capacity utilisation in FY2011, compared to 41.9% in
Shareholding Pattern (%)
FY2009, which is further expected to improve to 80% in FY2012E. In the fabric
Promoters
67.0
segment, the company plans to add 286 looms (479 current looms) in a phased
MF / Banks / Indian Fls
8.6
manner over FY2011-13. SSM will also be adding
400 machines in its
FII / NRIs / OCBs
0.0
readymade garment (RMG) segment by September 2011. Consequently, the
Indian Public / Others
24.4
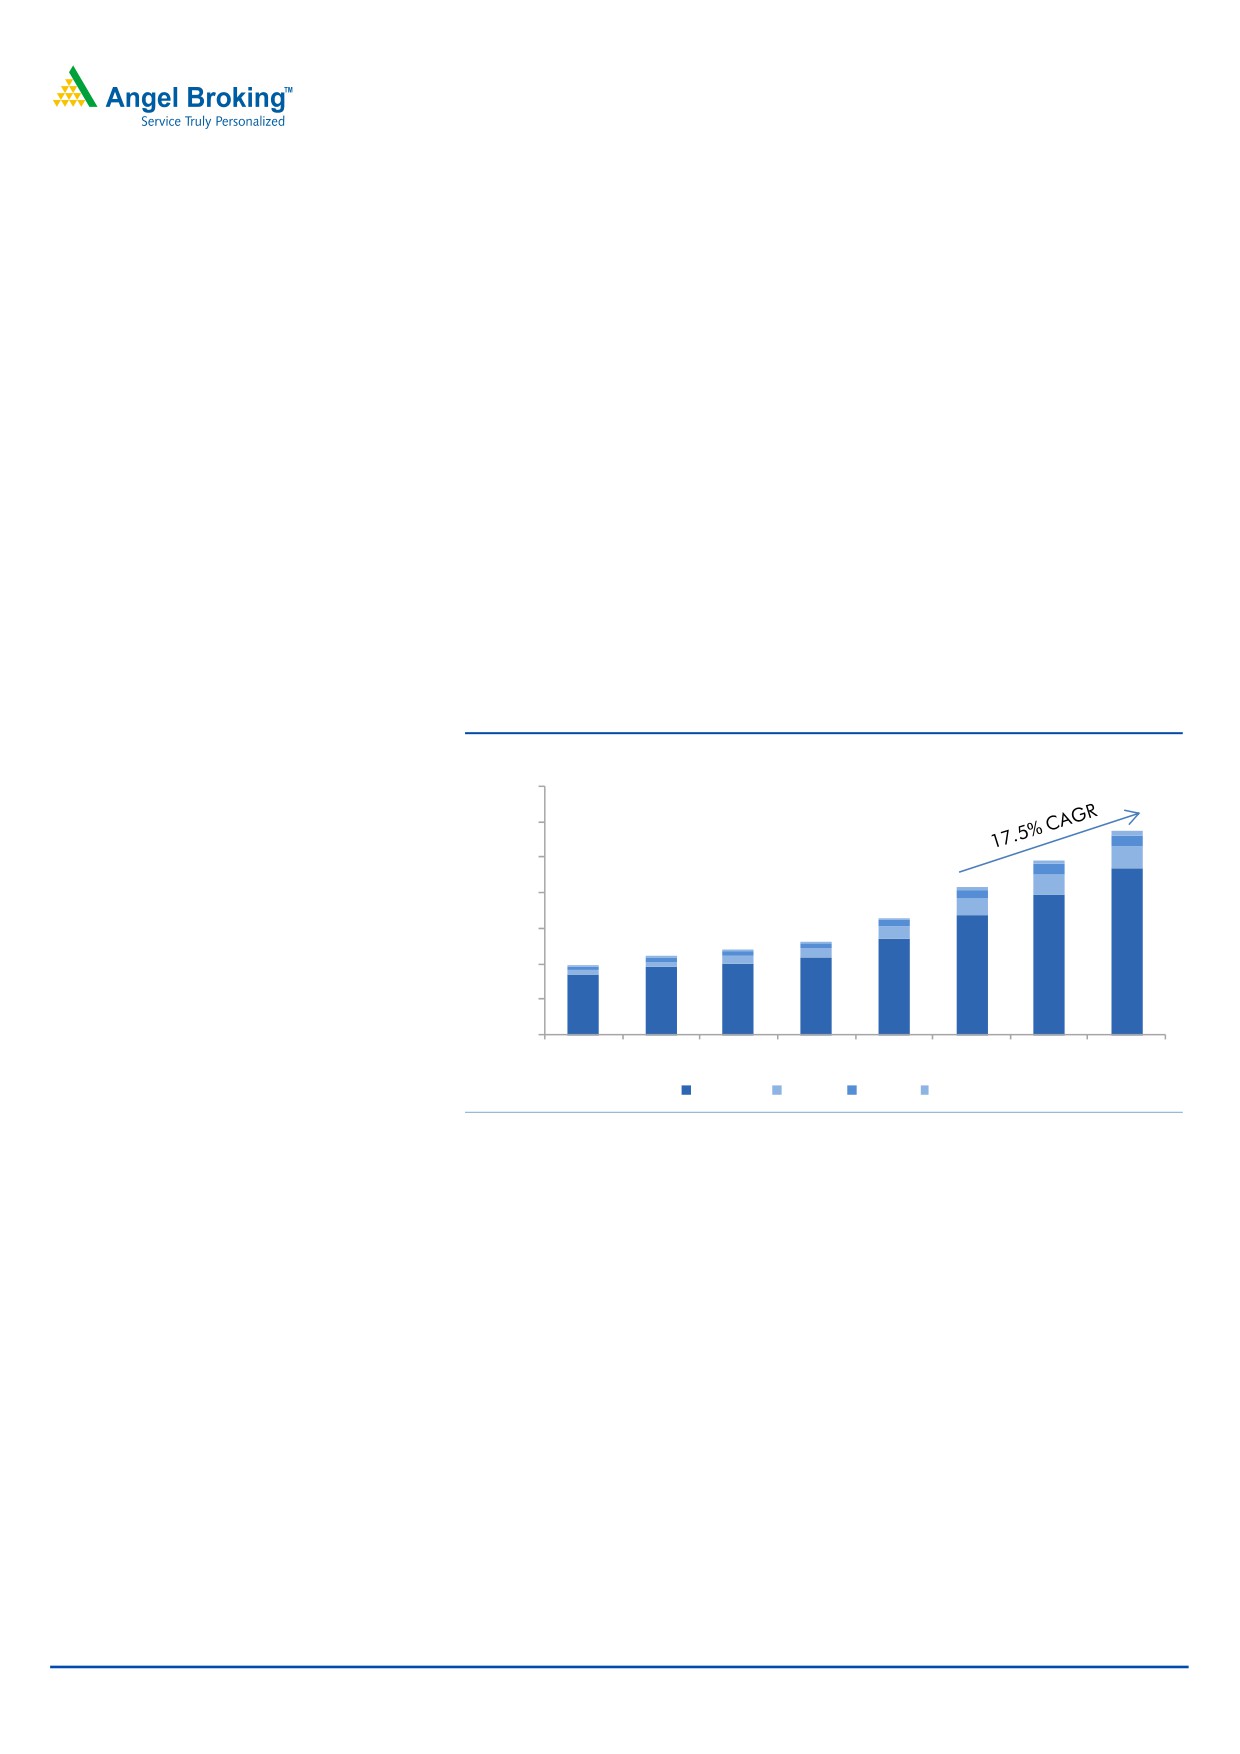
company is expected to report a 17.5% CAGR in revenue over FY2011-13.
Outlook and valuation: SSM generates 75% of its revenue through Tier-II&III
cities. Thus, the company is expected to benefit greatly from the growing
Abs. (%)
3m 1yr
3yr
middle-class population in the country, especially in small towns, and the shift in
Sensex
(1.2)
9.8
24.8
preference towards branded products. Moreover, the timely capacity expansion
Siyaram Silk Mills
7.2
118.7
264.0
will help SSM to take full advantage of the growing demand in India. The stock is
currently trading at 5.2x FY2013E earnings (as against its historical median of 6x
one-year forward EPS). We Initiate Coverage on SSM with an Accumulate
recommendation and a target price of `414, valuing the stock at 6x FY2013E
earnings.
Key financials
Y/E Mar. (` cr)
FY2010 FY2011E FY2012E FY2013E
Net sales
660
838
982
1,150
% chg
24.4
27.1
17.2
17.0
Net profit
34
56
60
65
% chg
194.2
65.5
7.3
8.1
FDEPS (`)
36
59
64
69
EBITDA margin (%)
10.6
12.9
12.2
11.6
P/E (x)
10.0
6.1
5.6
5.2
RoE (%)
21.6
29.0
25.1
22.4
RoCE (%)
13.0
19.8
17.7
17.4
P/BV (x)
2.0
1.6
1.3
1.1
Sharan Lillaney
EV/Sales (x)
0.8
0.7
0.6
0.5
022-39357800 Ext: 6811
EV/EBITDA (x)
7.5
5.6
5.2
4.6
Source: Company, Angel Research
Please refer to important disclosures at the end of this report
1
Siyaram Silk Mills | Initiating Coverage
Investment arguments
Well-known brand
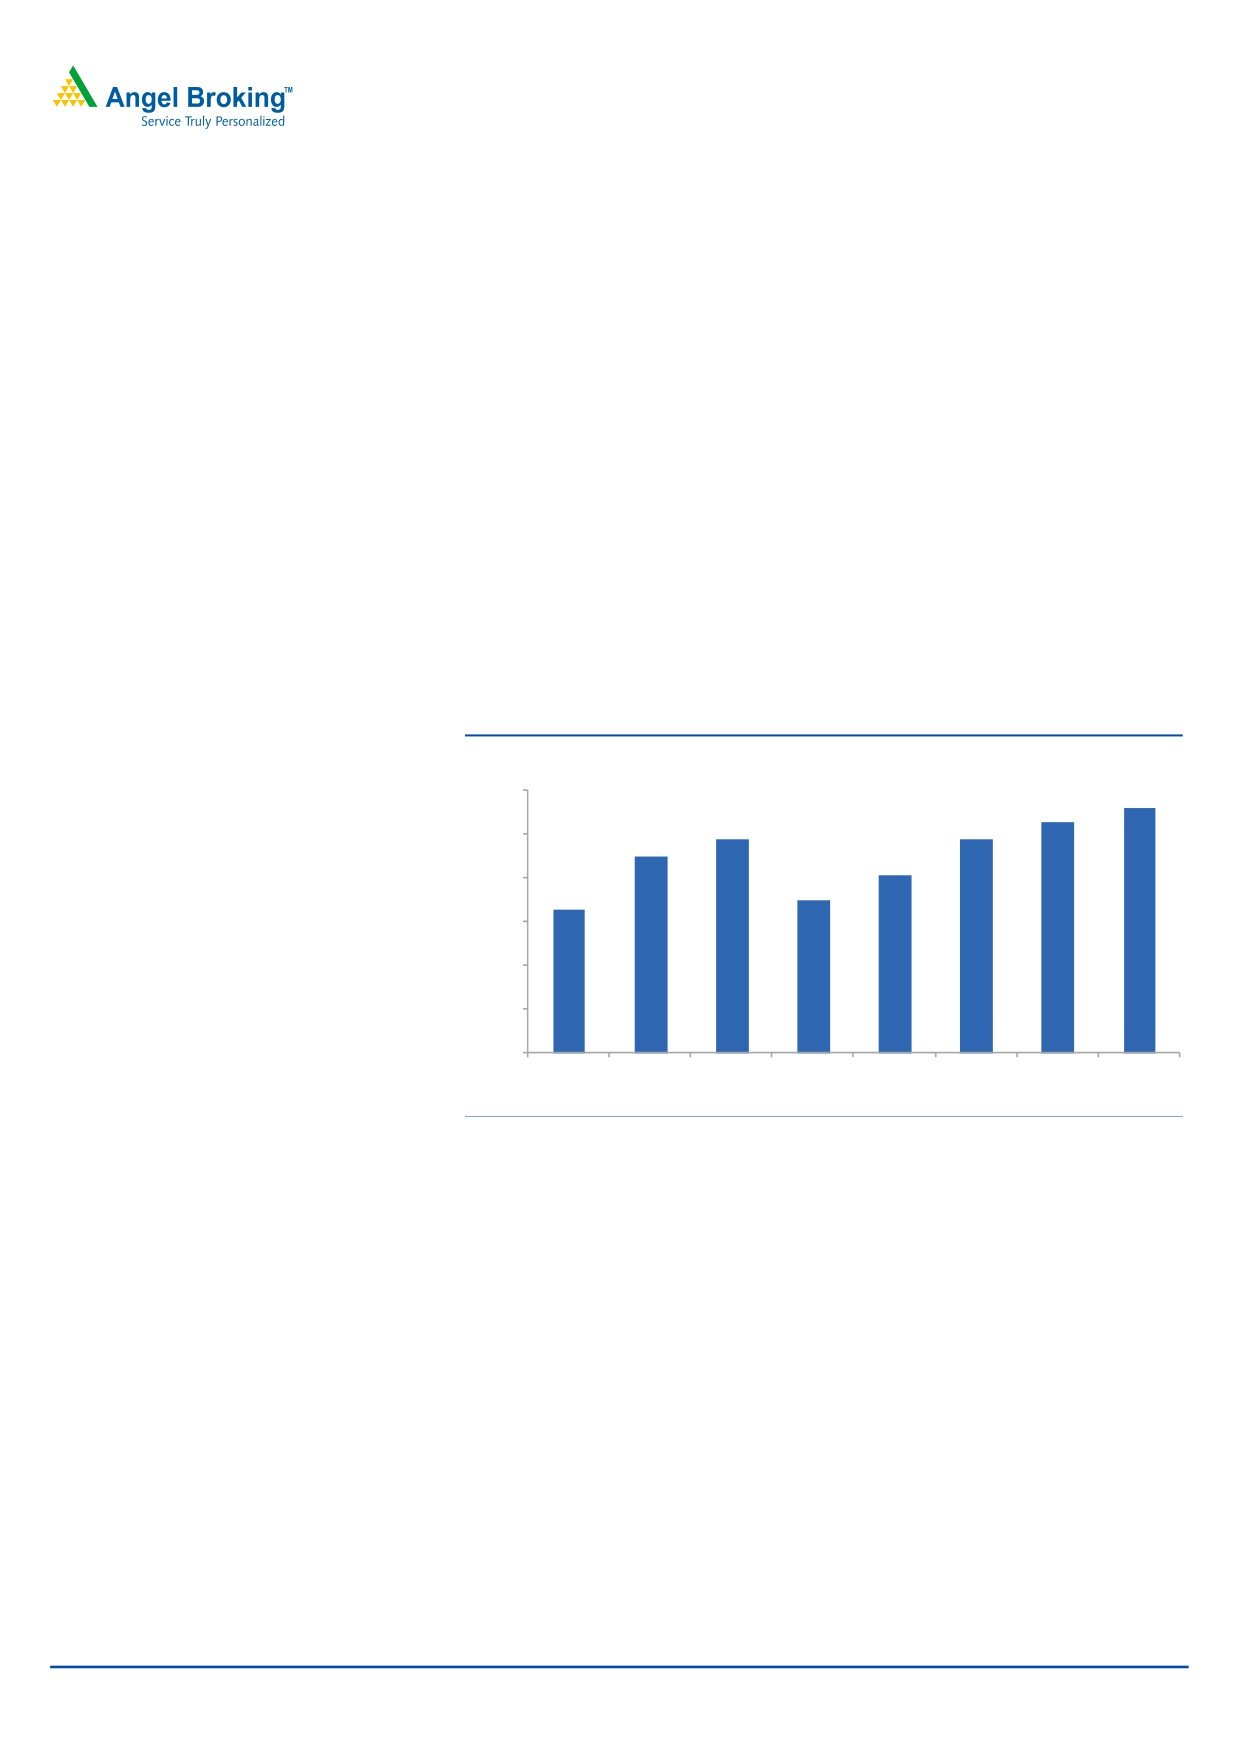
SSM has built a strong brand presence across India through its continuous
brand-building exercises over the last 30 years. The company spends 3-5% of its
net sales on advertising, which has helped it in creating a niche even in a highly
competitive environment. The company’s strong brand presence differentiates it
from other players and gives it an advantage to even charge a premium for its
products.
The company has signed popular personalities like Mahinder Singh Dhoni and
Hrithik Roshan as brand ambassadors for its brands to connect to the common
people of the country. Such strong branding efforts have given an edge to the
company over the years.
The company’s brands include Siyaram, Mistair and J Hampstead in the fabric
segments and Oxemberg and MSD in RMG segment.
Exhibit 1: Strong focus on advertising
(`cr)
30
28
26
24
24
25
22
20
20
17
16
15
10
5
-
FY2006
FY2007
FY2008
FY2009
FY2010
FY2011E FY2012E FY2013E
Source: Company, Angel Research
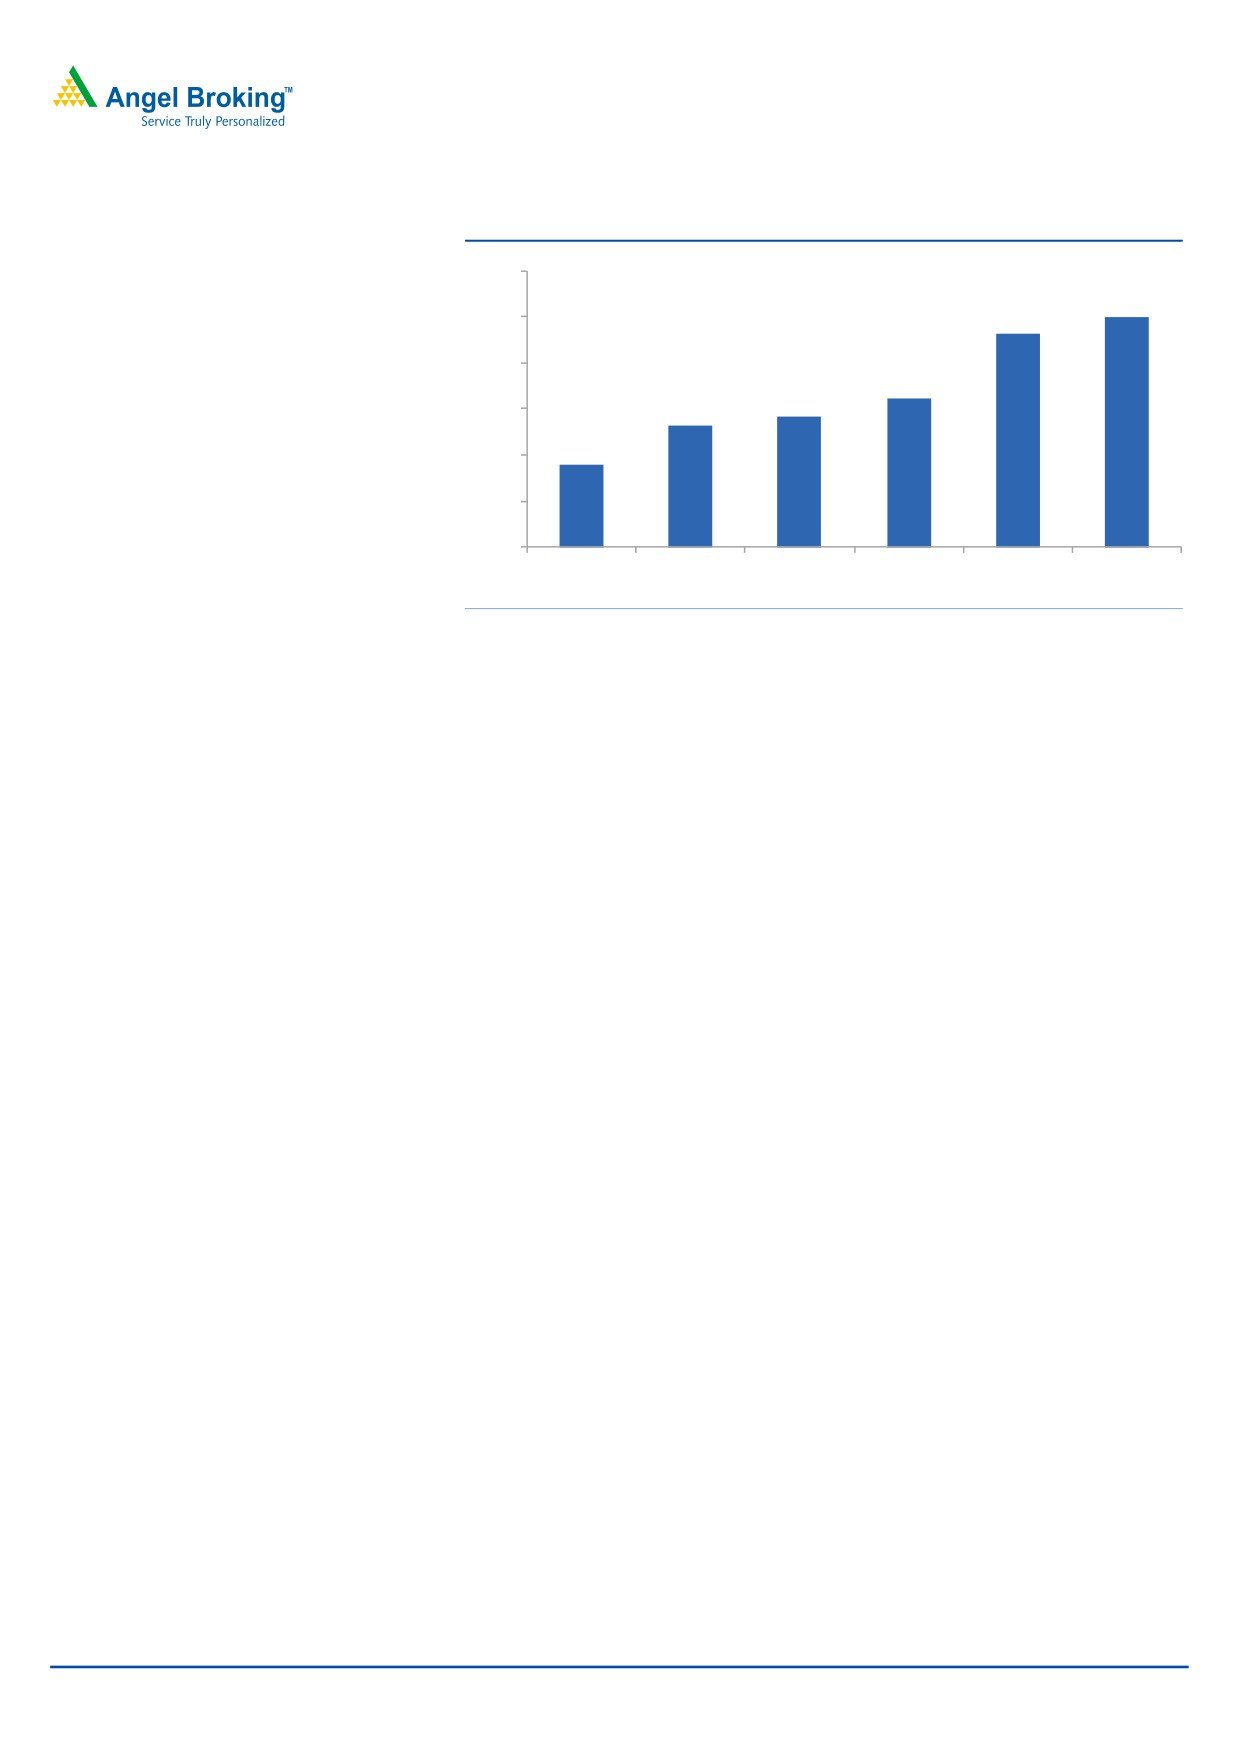
Pan-India distribution network - A key advantage
SSM has one of the largest distribution networks in the country. The company has
over 1,500 dealers and 500 agents supplying to over 40,000 outlets across India.
This wide network gives the company a sustainable competitive advantage and
helps it to easily introduce new products with a high success ratio.
April 8, 2011
2
Siyaram Silk Mills | Initiating Coverage
Exhibit 2: Robust growth in the number of agents across India
600
500
500
465
400
325
285
300
265
180
200
100
0
FY2005
FY2006
FY2007
FY2008
FY2009
FY2010
Source: Company, Angel Research
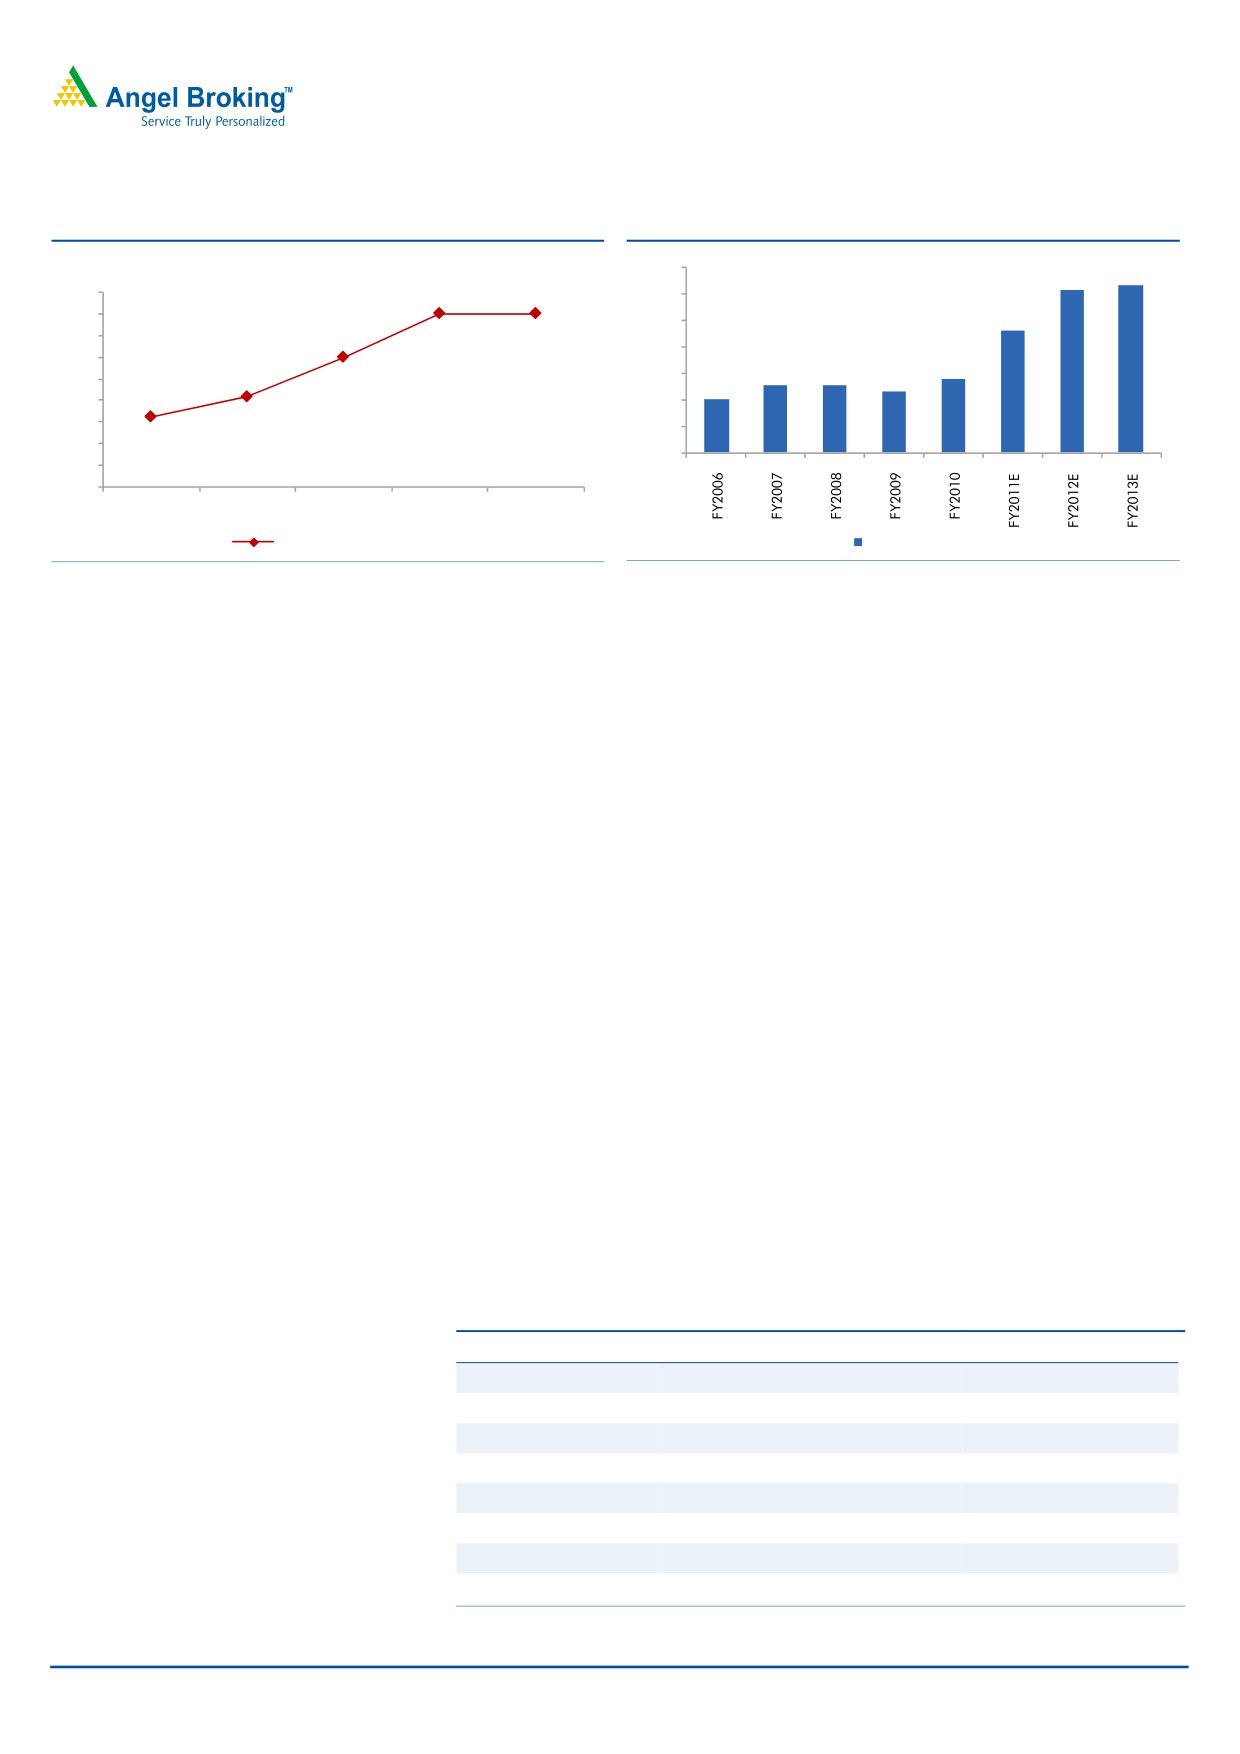
Higher utilisation to aid growth and maintain margins
SSM expanded its yarn dyeing capacity at the Tarapur facility to 60mn kgs in
FY2009 from 45mn kgs in FY2008. The company had initially considered setting
up yarn manufacturing and packaging operations at different locations but
decided against it and started building an integrated facility at its Tarapur factory
in FY2009. However, the construction activity was delayed, which adversely
affected the segment’s utilisation level. Nonetheless, the company has completed
the construction activity and the yarn segment is expected to achieve 60% capacity
utilisation for FY2011 compared to 41.9% in FY2010 and is further expected to
achieve 80% capacity in FY2012E.
The utilisation levels of the RMG and fabric segments have also been improving
on the back of strong demand growth. In FY2010, the RMG segment produced
1.7mn pieces with
645 machines. For FY2011, we expect the segment’s
production to increase to around
2.2mn pieces with the same number
of machines.
Better utilisation across all segments will lead to growth in the company’s volume
and revenue, resulting in better profits and margins, as visible in 9MFY2011,
where the company reported a 260bp and 245bp increase in margins to 12.5%
and 6.3% at the EBITDA and PAT level, respectively.
April 8, 2011
3
Siyaram Silk Mills | Initiating Coverage
Exhibit 3: Yarn segment’s increasing capacity utilisation
Exhibit 4: ...leading to strong revenue growth
(%)
70
63
61
90
80.0
80.0
60
80
46
50
70
60.0
40
60
28
41.9
30
25
25
23
50
20
32.7
40
20
30
10
20
-
10
0
FY2009
FY2010
FY2011E
FY2012E
FY2013E
Yarn Capacity utilisation
Revenue (`cr)
Source: Company, Angel Research
Source: Company, Angel Research
Capacity expansion to drive growth
SSM is currently on a strong expansion mode to cater to the growing demand for
its products.
SSM has 479 looms and produced 53.1mn mtrs in FY2010 in its fabric segment.
The company plans to add another 286 looms in a phased manner by FY2013,
which will increase its capacity by 26.4mn mtrs/p.a. at full capacity. This capacity
expansion will result in a ~50% increase in volume growth for the segment.
Capacity addition will be done at the Silvassa and Tarapur plants. We expect the
fabric segment to report a 15.1% CAGR in volumes over FY2011-13E to 85.7mn
mtrs in FY2013E from 64.7mn mtrs in FY2011E. In absolute terms, we expect the
fabric segment’s revenue to grow from `680cr in FY2011E to `946cr in FY2013E,
registering a 17.9% CAGR.
The company’s RMG segment has 645 stitching machines currently and is
expected to produce 2.2mn garments in FY2011E. The company plans to add
another 400 stitching machines by 2QFY2012, producing 0.48mn pcs/p.a. at the
Daman plant. This is expected to give the company a 22% volume boost annually.
In absolute terms, over FY2011-13E, we expect SSM’s sales volume to register a
14.9% CAGR to 2.8mn pcs/p.a. and revenue to report a 16.3% CAGR to `128cr.
The total planned capex will be around `198cr, of which `136cr will be utilised for
machinery and `62cr for land and building expansion.
Exhibit 5: Capacity expansion plans
Segment
Period
Planned expansion
Production capacity
Fabric
No. of looms
(mn mtrs/p.a)
Phase 1
2QFY2012
78
7.2
Phase 2
4QFY2012
120
13.2
Phase 3
2QFY2013
88
6.0
Total
2QFY2013
286
26.4
RMG
No. of stitching machines
(pieces/p.a)
Phase 1
2QFY2012
400
480,000
Source: Company, Angel Research
April 8, 2011
4
Siyaram Silk Mills | Initiating Coverage
Exhibit 6: Fabric segment - Revenue and volume trend
Exhibit 7: RMG segment - Revenue and volume trend
(`cr)
(mn)
(`cr)
(mn)
2.8
1,000
100
140
2.6
3.0
86
900
90
120
2.2
2.5
72
800
80
65
700
60
70
100
1.8
2.0
600
60
1.5
47
80
500
50
1.5
60
400
40
1.0
300
30
40
200
20
0.5
20
100
441
548
680
792
946
10
55
72
94
113
128
-
-
-
-
FY2009
FY2010
FY2011E
FY2012E FY2013E
FY2009
FY2010
FY2011E
FY2012E
FY2013E
Revenue (LHS)
Fabrics (mtrs)
Revenue (LHS)
RMG (pieces)
Source: Company, Angel Research
Source: Company, Angel Research
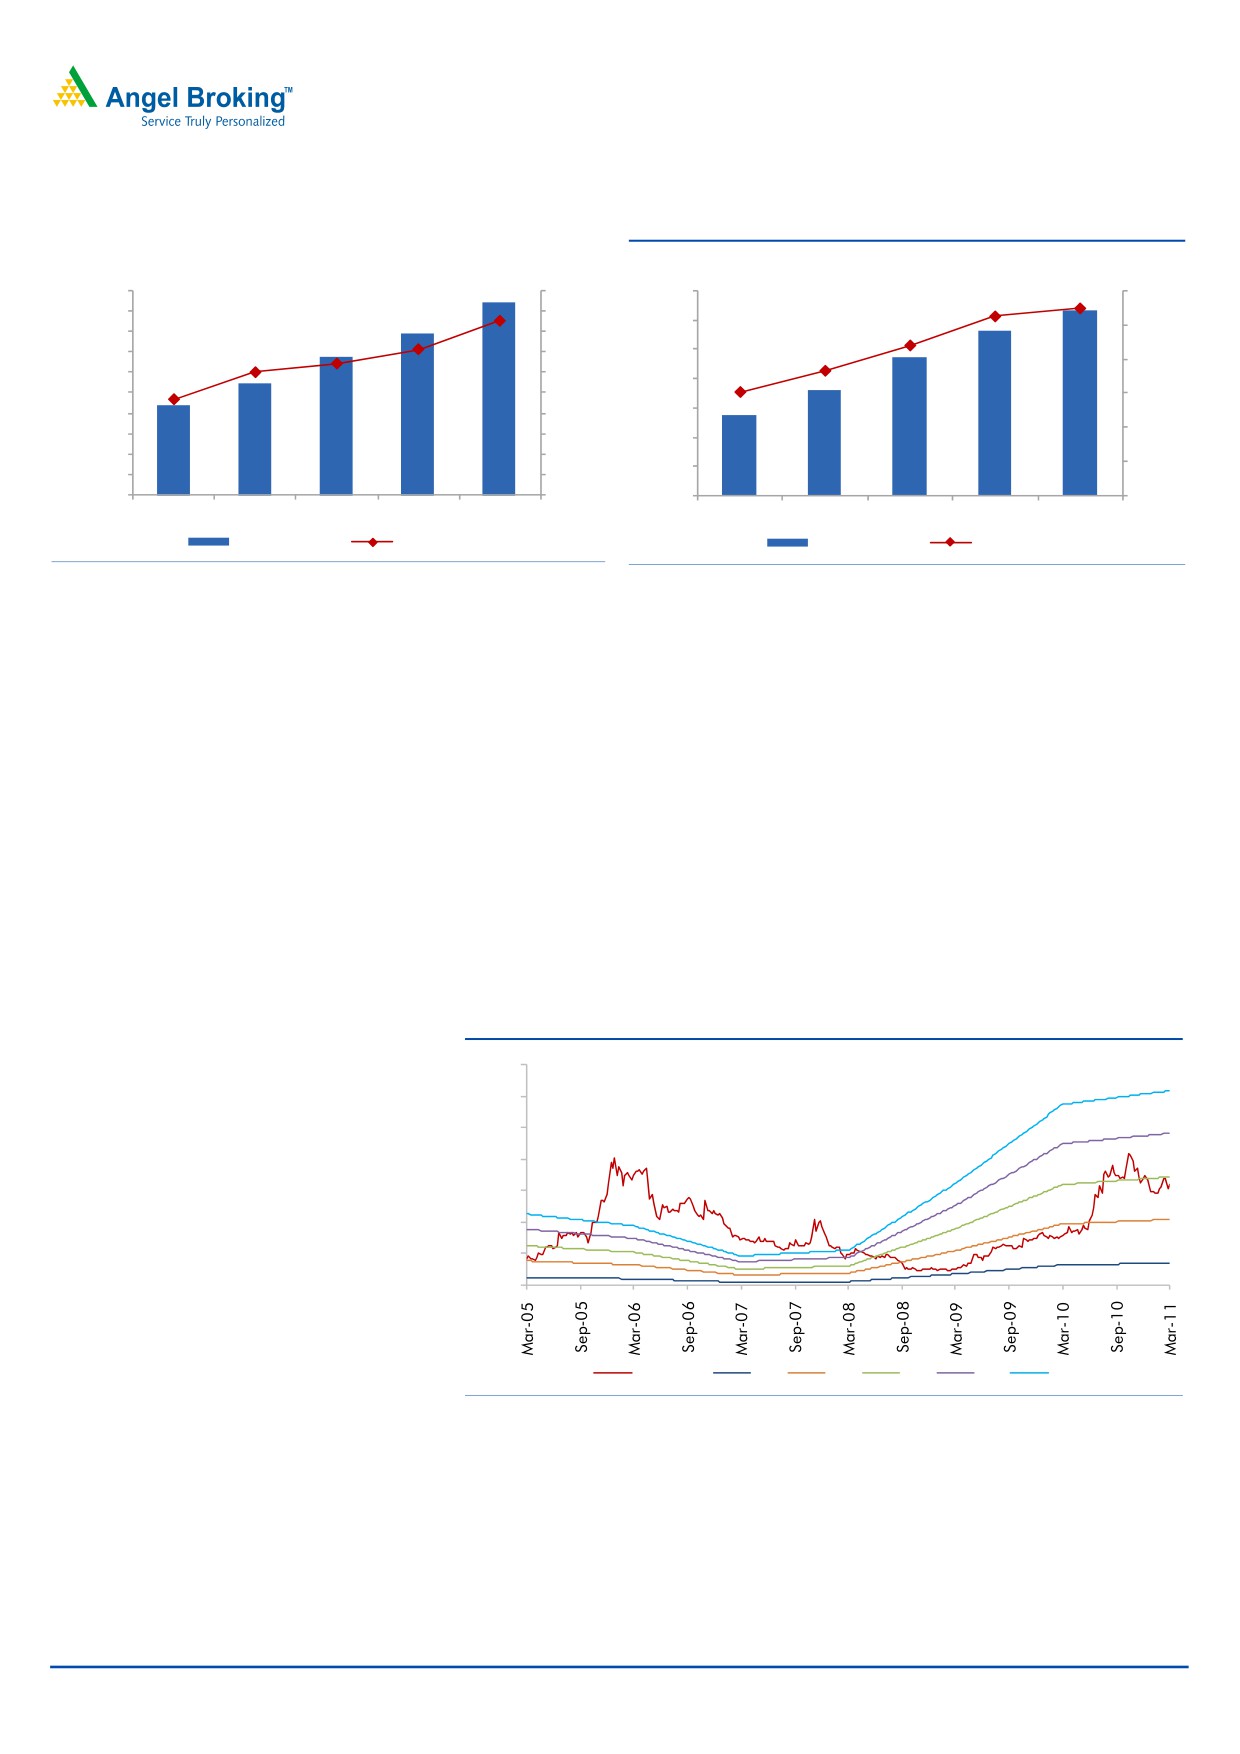
Outlook and valuation
SSM generates 75% of its revenue through Tier-II&III cities. Thus, the company is
expected to benefit greatly from the growing middle-class population in the
country, especially in small towns, and the shift in preference towards branded
products. Further, timely capacity expansion will help the company to take full
advantage of growing demand in India.
With strong growth across all segments, we expect SSM to register a 17.5% CAGR
in revenue. SSM, a dominant player in the industry, has over 20% RoE and is
currently available at an attractive valuation of just 5.2x FY2013E earnings (as
against its historical median of 6x one-year forward EPS). We Initiate Coverage on
the stock with an Accumulate recommendation and a target price of `414, valuing
the stock at 6x FY2013E earnings.
Exhibit 8: One-year forward P/E band
700
600
500
400
300
200
100
0
Price (`)
1x
3x
5x
7x
9x
Source: Company, Angel Research
April 8, 2011
5
Siyaram Silk Mills | Initiating Coverage
Concerns
Competition from the unorganised sector
SSM operates in a highly unorganised sector. The company can face intense
competition from unorganised players as they usually sell their products at a much
cheaper rate compared to SSM. In the organised sector, the company’s products
are cheaper than peers. However, we believe due to strong branding efforts and a
huge distribution network, the company has been easily able to differentiate its
products from those of competitors.
Delay in capacity expansion
SSM is expected to increase its fabric capacity by ~50% by adding 400 stitching
machines by 2QFY2012. Any delay in capacity expansion plans due to unforeseen
reasons can have a negative impact on the company’s revenue growth and
profitability.
Fluctuations in raw-material prices
SSM operates in a highly price-sensitive market. Any fluctuation in raw-material
prices can lead to margin compression, as the company may not be able to pass
on the entire increase to the end-user. However, we believe SSM’s ability to pass
on the increase is partly aided by its strong brand presence and a large client
base. For instance, in 9MFY2011, despite the substantial increase in raw-material
prices, the company did not face any margin pressure.
April 8, 2011
6
Siyaram Silk Mills | Initiating Coverage
Financial overview
In FY2010, SSM registered strong growth of 24.4% yoy in revenue, largely due to
improved economic conditions as well as capacity expansion. The company
continued to report strong performance in FY2011, registering robust 29.4% yoy
growth in revenue for 9MFY2011 to `613cr from `474cr in 9MFY2010, aided by
strong realisations and higher utilisation.
For 4QFY2011E, we expect strong growth to continue across all segments,
especially the fabrics and yarn segments, on the back of higher utilisation. For
FY2011, we expect strong top-line growth of `179cr (27.1%) yoy to `838cr
compared to `660cr in FY2009, largely due to strong growth across all segments
(fabrics, RMG and yarn), which are expected to post 24.2%, 30.4% and 66% yoy
growth, respectively. Further, we expect all segments to register strong growth on
account of robust demand and shift in consumer preference towards banded
products.
Going ahead, we expect the company's top line to register a 17.5% CAGR over
FGY2011-13E, increasing to `982cr in FY2012 and `1,150cr in FY2013.
Exhibit 9: Strong growth trajectory
(`cr)
1,400
1,200
1,000
800
600
400
200
0
FY2006
FY2007
FY2008
FY2009
FY2010 FY2011E FY2012E FY2013E
Fabrics
RMG Yarn Others
Source: Company, Angel Research
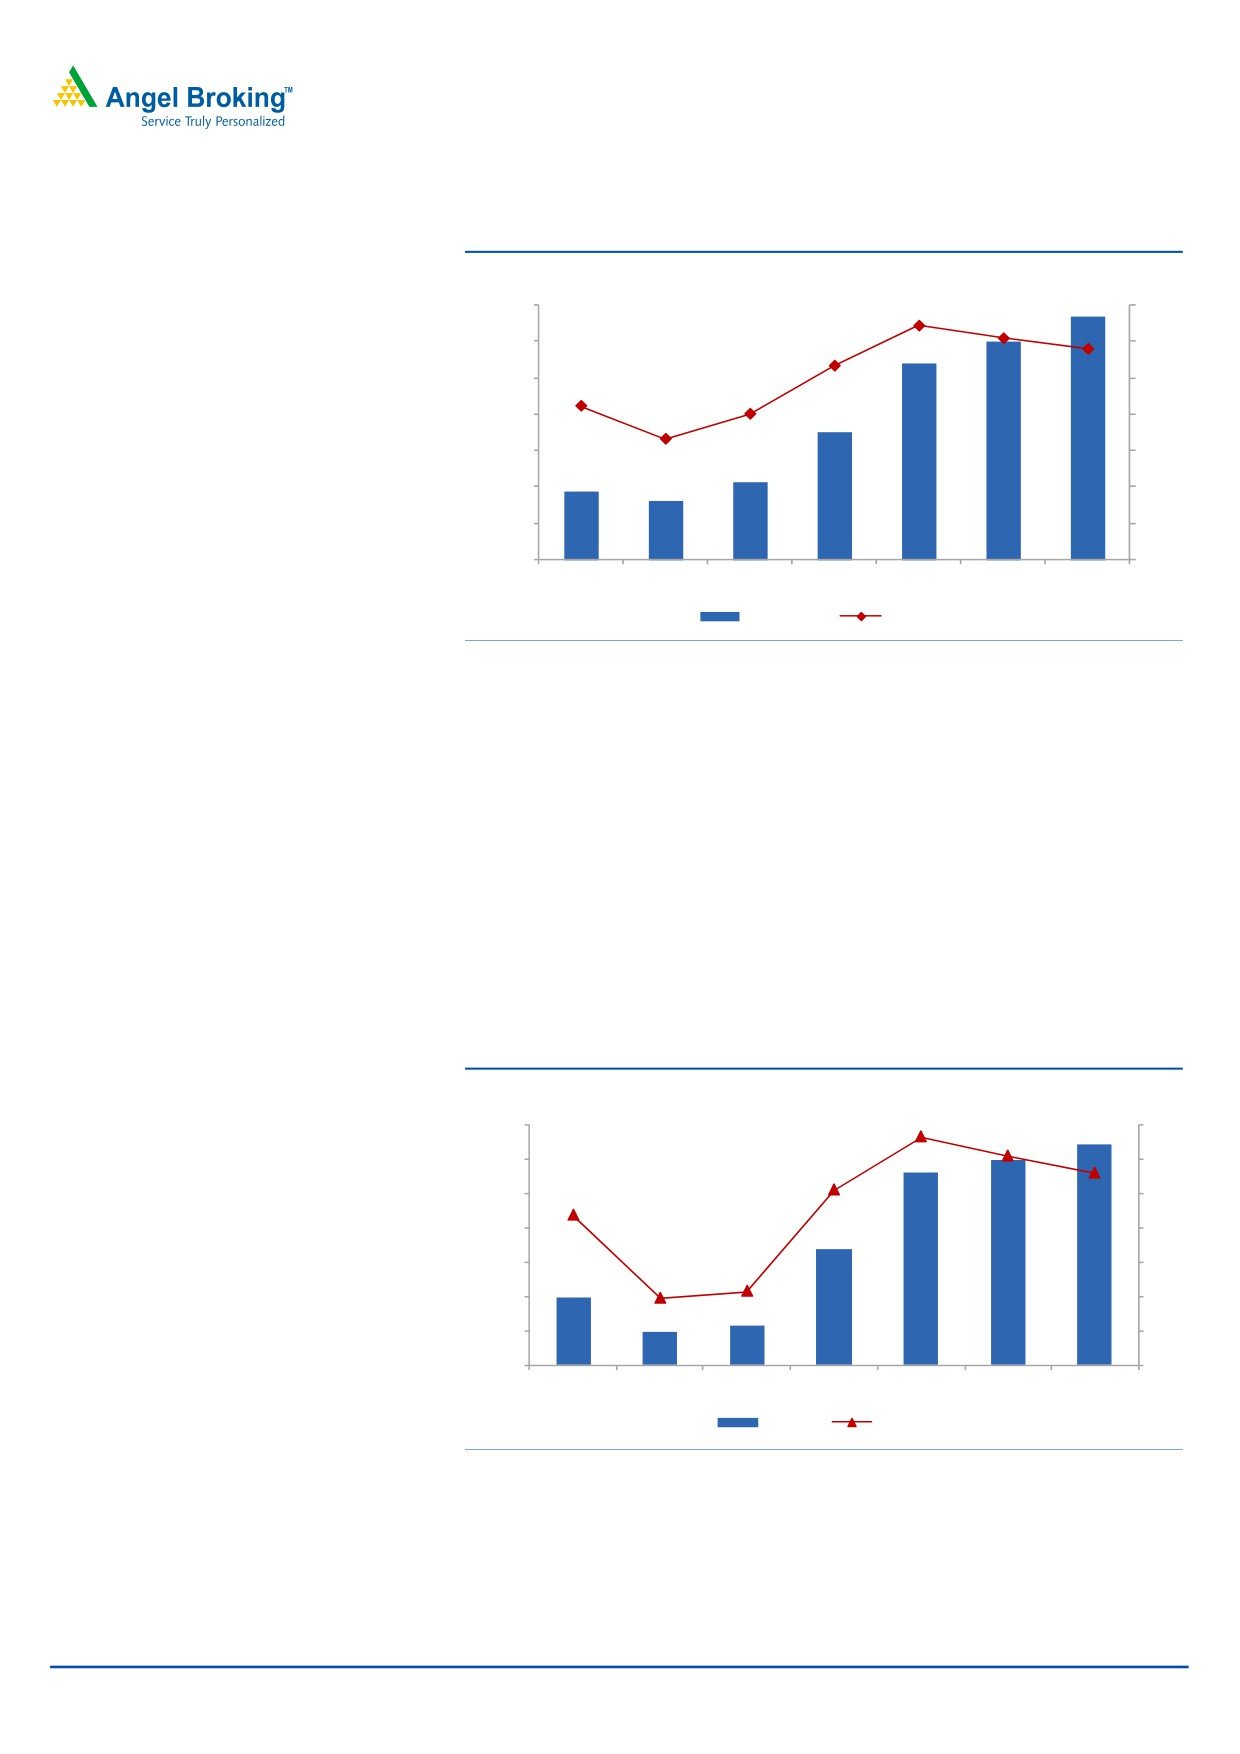
EBITDA margins to remain in line
For FY2010, SSM’s operating margin improved to 10.6% (8.0%), largely on the
back of lower operating expenses, which came down to 19.4% of revenue in
FY2010 versus 21.8% in FY2009. However, for 9MFY2011, the company’s
operating margin increased by 260bp to 12.5% yoy due to higher utilisation and
strong ability of the company to pass on any increase in raw-material prices
without any margin erosion.
SSM’s EBITDA margin has been improving qoq from 11.5% in 1QFY2011 to
12.7% in 2QFY2011 and 13.1% in 3QFY2011. The company’s margin is further
expected to improve to 13.8% in 4QFY2011E, as historically margins have always
been strongest in 4Q. For FY2011E, we estimate the company to report EBITDA
margin of 12.9%. Conservatively, keeping a margin of safety on the back of the
company’s historical margins, we expect EBITDA margin to slightly come down to
12.2% and 11.6% in FY2012E and FY2013E, respectively. EBITDA is estimated to
increase from `70cr in FY2010 to `133cr in FY2013E on the back of strong
revenue growth.
April 8, 2011
7
Siyaram Silk Mills | Initiating Coverage
Exhibit 10: EBITDA margin to stabilise
(`cr)
(%)
140
12.9
14
12.2
11.6
120
10.6
12
10
100
8.4
8.0
80
6.6
8
60
6
40
4
20
2
38
32
42
70
108
119
133
-
0
FY2007 FY2008 FY2009 FY2010 FY2011E FY2012E FY2013E
EBITDA
Margin
Source: Company, Angel Research
Net profit to register a 24.1% CAGR over FY2010-13E
In FY2010, SSM’s net profit margin increased by 294bp to 5.1% (2.2%), primarily
because of higher operating margins during the year. For FY2011, we estimate net
profit margin to increase substantially to 6.6% (5.1%) on the back of strong EBITDA
margin expansion. For 9MFY2011, net profit surged by 110.9% yoy to `39cr from
`18cr in 9MFY2010 due strong revenue growth as well as margin expansion.
Thus, net profit is expected to increase to `56cr in FY2011 from `34cr in FY2010.
For FY2012 and FY2013, we estimate net profit margin to marginally decline to
6.1% and 5.6% to `60cr and `64cr, respectively, on the back of a decline in
EBITDA margin. Overall, the company is expected to register a 24.1% CAGR in
PAT over FY2010-13E.
Exhibit 11: PAT to increase steadily
(`cr)
(%)
6.6
70
5.6
7
6.1
60
6
5.1
50
4.4
5
40
4
30
2.2
3
2.0
20
2
10
1
20
10
11
34
56
60
64
-
0
FY2007 FY2008 FY2009 FY2010 FY2011E FY2012E FY2013E
PAT
Margin
Source: Company, Angel Research
April 8, 2011
8
Siyaram Silk Mills | Initiating Coverage
Company background
SSM is a part of the Siyaram-Poddar Group. The company began operating in
1978 as a fabric manufacturer and eventually diversified into the RMG segment.
The company is one of the most renowned vertically integrated textile companies in
India. The company’s plants are located at Daman, Silvassa and Tarapur.
SSM operates mainly in two branded segments - fabrics and RMG. In the fabrics
segment, the company sells its products under popular brands Siyaram, Mistair
and J Hampstead, catering to the low, medium and premium segments,
respectively. The RMG segment has two major brands MSD (casual wear) and
Oxemberg (formal wear), which cater to the medium segment. The company also
has an unbranded segment, the yarn dyeing segment.
Other group companies of the Siyaram-Poddar Group include Balkrishna
Industries and Govind Rubber.
April 8, 2011
9
Siyaram Silk Mills | Initiating Coverage
Profit & loss statement
Y/E Mar. (` cr)
FY08
FY09
FY10
FY11E
FY12E
FY13E
Net sales
486
530
660
838
982
1,150
% chg
8.8
9.1
24.4
27.1
17.2
17.0
Total expenditure
454
488
589
730
863
1,017
Consumption of raw materials
211
209
258
369
427
500
Employee cost
30
33
39
48
56
66
Other expenditure
114
116
128
168
188
216
Processing, excise & labour charges
69
70
84
106
124
145
Purchase of traded goods
62
48
71
93
103
115
Other
-
-
-
-
-
-
EBITDA
32
42
70
108
119
133
% chg
(14.8)
32.0
66.1
53.5
10.8
11.4
(% of net sales)
6.6
8.0
10.6
12.9
12.2
11.6
Depreciation & amortisation
17
19
20
21
25
31
EBIT
15
23
50
87
95
102
% chg
(29.8)
49.3
116.5
73.4
9.3
7.8
(% of net sales)
3.2
4.4
7.6
10.4
9.7
8.9
Interest & other charges
10.7
16.8
12
13
16
17
Adj. other income
7.5
8.4
11
8
8
9
(% of PBT)
61.1
57.1
22.3
9.8
9.6
9.3
Share in profit of associates
-
-
-
-
-
-
Recurring PBT
12
15
49
81
87
94
% chg
(47.0)
19.5
234.6
65.9
7.3
8.1
Extraordinary expense/(inc.)
-
-
-
-
-
-
PBT (reported)
12
15
49
81
87
94
Tax
2.7
3.2
15
26
27
30
(% of PBT)
22.4
21.9
31.3
31.5
31.5
31.5
PAT (reported)
10
11
34
56
60
65
Add: Share of earnings of associate
-
-
-
-
-
-
Less: Minority interest (MI)
-
-
-
-
-
-
% chg
(51.3)
20.4
194.2
65.5
7.3
8.1
Prior period items
-
-
-
-
-
-
PAT after MI (reported)
10
11
34
56
60
65
Extraordinary income post tax
-
-
-
-
-
-
ADJ. PAT
10
11
34
56
60
65
% chg
(51.3)
20.4
194.2
65.5
7.3
8.1
(% of Net sales)
2.0
2.2
5.1
6.6
6.1
5.6
Basic EPS (`)
10.1
12.2
35.9
59.4
63.8
69.0
Fully diluted EPS (`)
10.1
12.2
35.9
59.4
63.8
69.0
% chg
(51.3)
20.4
194.2
65.5
7.3
8.1
April 8, 2011
10
Siyaram Silk Mills | Initiating Coverage
Balance sheet
Y/E Mar. (` cr)
FY08 FY09 FY10 FY11E FY12E FY13E
SOURCES OF FUNDS
Equity share capital
9.4
9.4
9.4
9.4
9.4
9.4
Reserves & surplus
127
133
160
205
253
305
Shareholders’ funds
136
142
170
214
262
314
Total loans
270
233
190
269
289
274
Deferred tax liability
17
18
18
18
18
18
Total Liabilities
424
393
378
501
569
605
APPLICATION OF FUNDS
Gross block
303
325
337
338
438
538
Less: Acc. depreciation
101
120
137
158
183
214
Net block
201
205
200
180
255
324
Capital work-in-progress
5
2
-
100
75
-
Investments
-
-
28
17
17
17
Current assets
276
248
251
320
358
414
Cash
1.1
2.1
2.9
2.0
2.3
2.2
Loans & advances
33
34
42
56
56
56
Inventories
109
97
89
133
151
183
Debtors
133
114
117
128
149
173
Current liabilities
58
61
102
115
136
149
Net current assets
218
186
149
205
222
265
Total assets
424
393
378
501
569
605
April 8, 2011
11
Siyaram Silk Mills | Initiating Coverage
Cash flow statement
Y/E Mar. (` cr)
FY08 FY09 FY10 FY11E FY12E FY13E
Profit before tax
12
15
49
81
87
94
Depreciation
17
19
20
21
25
31
Change in working capital
(42)
34
46
(42)
(17)
(43)
Less: Other income
7
8
11
8
8
9
Direct taxes paid
3
3
15
26
27
30
Cash flow from operations
(24)
56
89
26
59
44
Inc./(Dec.) in fixed assets
(44)
(19)
(11)
(100)
(75)
(25)
Inc./(Dec.) in investments
(0)
0
(28)
12
-
-
Inc./(Dec.) in loans and adv.
(12)
(1)
(8)
(14)
-
-
Other income
7
8
11
8
8
9
Cash flow from investing
(48)
(12)
(36)
(94)
(67)
(16)
Issue/(buy back) of equity
-
-
-
-
-
-
Inc./(Dec.) in loans
77
(38)
(43)
79
20
(15)
Dividend paid (Incl. tax)
(5)
(5)
(7)
(11)
(12)
(13)
Others
(0)
0
(2)
(1)
-
-
Cash flow from financing
71
(43)
(52)
67
8
(28)
Inc./(Dec.) in cash
(0.3)
1.0
0.8
(0.9)
0.3
(0.1)
Opening cash balances
1.4
1.1
2.1
2.9
2.0
2.3
Closing cash balances
1.1
2.1
2.9
2.0
2.3
2.2
April 8, 2011
12
Siyaram Silk Mills | Initiating Coverage
Key ratios
Y/E Mar.
FY08 FY09 FY10
FY11E
FY12E
FY13E
Valuation Ratio (x)
P/E (on FDEPS)
35.5
29.5
10.0
6.1
5.6
5.2
P/E (on basic, reported EPS)
35.5
29.5
10.0
6.1
5.6
5.2
P/CEPS
12.9
11.0
6.3
4.4
4.0
3.5
P/BV
2.5
2.4
2.0
1.6
1.3
1.1
Dividend yield (%)
1.4
1.4
1.7
2.8
3.0
3.3
Market cap. / Sales
0.7
0.6
0.5
0.4
0.3
0.3
EV/Sales
1.2
1.1
0.8
0.7
0.6
0.5
EV/EBITDA
18.9
13.4
7.5
5.6
5.2
4.6
EV / Total assets
1.4
1.4
1.4
1.2
1.1
1.0
Per share data (`)
EPS (basic)
10.1
12.2
35.9
59.4
63.8
69.0
EPS (fully diluted)
10.1
12.2
35.9
59.4
63.8
69.0
Cash EPS
27.8
32.7
57.5
81.9
90.1
101.9
DPS
5
5
6
10
11
12
Book value
145.5
151.8
181.2
228.8
279.7
334.9
DuPont analysis (%)
EBIT margin
3.2
4.4
7.6
10.4
9.7
8.9
Tax retention ratio
77.6
78.1
68.7
68.5
68.5
68.5
Asset turnover (x)
1.3
1.3
1.8
2.0
1.9
2.0
ROIC (Post-tax)
3.1
4.4
9.3
14.3
12.6
12.3
Cost of debt (Post tax)
3.6
5.2
3.9
4.0
3.9
4.1
Leverage (x)
1.7
1.8
1.2
1.1
1.1
0.9
Operating ROE
2.4
3.1
16.0
25.2
21.7
19.7
Returns (%)
ROCE (Pre-tax)
4.0
5.7
13.0
19.8
17.7
17.4
Angel ROIC (Pre-tax)
4.2
5.7
13.6
23.8
22.1
19.3
ROE
7.1
8.2
21.6
29.0
25.1
22.4
Turnover ratios (x)
Asset turnover (Gross block)
1.8
1.7
2.0
2.5
2.5
2.4
Asset turnover (Net block)
2.8
2.6
3.3
4.4
4.5
4.0
Asset turnover (Total assets)
1.3
1.3
1.7
1.9
1.8
2.0
Opt. income / Invested capital
1.3
1.3
1.8
2.0
1.9
2.0
Inventory / Sales (days)
69
71
52
48
53
53
Receivables (days)
98
85
64
53
51
51
Payables (days)
45
41
45
47
47
45
W.C. cycle (days)
142
138
91
76
78
77
Solvency ratios (x)
Gross debt to equity
2.0
1.6
1.1
1.3
1.1
0.9
Net debt to equity
2.0
1.6
0.9
1.2
1.0
0.8
Net debt to EBITDA
8.4
5.5
2.3
2.3
2.3
1.9
Interest Coverage (EBIT / Int.)
3.0
2.5
5.9
8.0
7.5
8.0
April 8, 2011
13
Siyaram Silk Mills | Initiating Coverage
Research Team Tel: 022 - 39357800
DISCLAIMER
This document is solely for the personal information of the recipient, and must not be singularly used as the basis of any investment
decision. Nothing in this document should be construed as investment or financial advice. Each recipient of this document should make
such investigations as they deem necessary to arrive at an independent evaluation of an investment in the securities of the companies
referred to in this document (including the merits and risks involved), and should consult their own advisors to determine the merits and
risks of such an investment.
Angel Broking Limited, its affiliates, directors, its proprietary trading and investment businesses may, from time to time, make
investment decisions that are inconsistent with or contradictory to the recommendations expressed herein. The views contained in this
document are those of the analyst, and the company may or may not subscribe to all the views expressed within.
Reports based on technical and derivative analysis center on studying charts of a stock's price movement, outstanding positions and
trading volume, as opposed to focusing on a company's fundamentals and, as such, may not match with a report on a company's
fundamentals.
The information in this document has been printed on the basis of publicly available information, internal data and other reliable
sources believed to be true, but we do not represent that it is accurate or complete and it should not be relied on as such, as this
document is for general guidance only. Angel Broking Limited or any of its affiliates/ group companies shall not be in any way
responsible for any loss or damage that may arise to any person from any inadvertent error in the information contained in this report.
Angel Broking Limited has not independently verified all the information contained within this document. Accordingly, we cannot testify,
nor make any representation or warranty, express or implied, to the accuracy, contents or data contained within this document. While
Angel Broking Limited endeavours to update on a reasonable basis the information discussed in this material, there may be regulatory,
compliance, or other reasons that prevent us from doing so.
This document is being supplied to you solely for your information, and its contents, information or data may not be reproduced,
redistributed or passed on, directly or indirectly.
Angel Broking Limited and its affiliates may seek to provide or have engaged in providing corporate finance, investment banking or
other advisory services in a merger or specific transaction to the companies referred to in this report, as on the date of this report or in
the past.
Neither Angel Broking Limited, nor its directors, employees or affiliates shall be liable for any loss or damage that may arise from or in
connection with the use of this information.
Note: Please refer to the important `Stock Holding Disclosure' report on the Angel website (Research Section). Also, please refer to the
latest update on respective stocks for the disclosure status in respect of those stocks. Angel Broking Limited and its affiliates may have
investment positions in the stocks recommended in this report.
Disclosure of Interest Statement
Siyaram Silk Mills
1. Analyst ownership of the stock
No
2. Angel and its Group companies ownership of the stock
No
3. Angel and its Group companies' Directors ownership of the stock
No
4. Broking relationship with company covered
No
Note: We have not considered any Exposure below ` 1 lakh for Angel, its Group companies and Directors
Ratings (Returns):
Buy (> 15%)
Accumulate (5% to 15%)
Neutral (-5 to 5%)
Reduce (-5% to 15%)
Sell (< -15%)
April 8, 2011
14
Siyaram Silk Mills | Initiating Coverage
6th Floor, Ackruti Star, Central Road, MIDC, Andheri (E), Mumbai- 400 093.
Tel: (022) 39357800
Research Team
Fundamental:
Sarabjit Kour Nangra
VP-Research, Pharmaceutical
Vaibhav Agrawal
VP-Research, Banking
Shailesh Kanani
Infrastructure
Param Desai
Real Estate, Logistics, Shipping
Sageraj Bariya
Fertiliser, Mid-cap
Srishti Anand
IT, Telecom
Bhavesh Chauhan
Metals, Mining
Jai Sharda
Mid-cap
Sharan Lillaney
Mid-cap
Naitik Mody
Mid-cap
Chitrangda Kapur
FMCG, Media
Amit Vora
Research Associate (Oil & Gas)
V Srinivasan
Research Associate (Cement, Power)
Mihir Salot
Research Associate (Logistics, Shipping)
Pooja Jain
Research Associate (Metals & Mining)
Yaresh Kothari
Research Associate (Automobile)
Shrinivas Bhutda
Research Associate (Banking)
Sreekanth P.V.S
Research Associate (FMCG, Media)
Hemang Thaker
Research Associate (Capital Goods)
Nitin Arora
Research Associate (Infra, Real Estate)
Ankita Somani
Research Associate (IT, Telecom)
Varun Varma
Research Associate (Banking)
Vasant Lohiya
Research Associate (Banking)
Poonam Sanghvi
Research Associate (Pharmaceutical)
Technicals:
Shardul Kulkarni
Sr. Technical Analyst
Mileen Vasudeo
Technical Analyst
Derivatives:
Siddarth Bhamre
Head - Derivatives
Jaya Agarwal
Derivative Analyst
Institutional Sales Team:
Mayuresh Joshi
VP - Institutional Sales
Abhimanyu Sofat
AVP - Institutional Sales
Pranav Modi
Sr. Manager
Jay Harsora
Manager
Meenakshi Chavan
Dealer
Gaurang Tisani
Dealer
Production Team:
Simran Kaur
Research Editor
Bharat Patil
Production
Dilip Patel
Production
Angel Broking Ltd: BSE Sebi Regn No : INB 010996539 / CDSL Regn No: IN - DP - CDSL - 234 - 2004 / PMS Regn Code: PM/INP000001546 Angel Securities Ltd:BSE: INB010994639/INF010994639 NSE: INB230994635/INF230994635 Membership numbers: BSE 028/NSE:09946
Angel Capital & Debt Market Ltd: INB 231279838 / NSE FNO: INF 231279838 / NSE Member code -12798 Angel Commodities Broking (P) Ltd: MCX Member ID: 12685 / FMC Regn No: MCX / TCM / CORP / 0037 NCDEX : Member ID 00220 / FMC Regn No: NCDEX / TCM / CORP / 0302
April 8, 2011
15